Monday, July 28, 2014

Quiz #33: Arterial line traces - Answer

Question:
13-year old patient who underwent repair of coarctation of aorta earlier that day has two arterial lines, right radial & left femoral. According to the reading on the monitor, apparent peak to peak pressure gradient across the coarctation repair site is 37 mmHg.

Question: Based on the traces in each arterial line, is the pressure gradient higher than, lower than or equal to 37 mmHg? Why?

Answer:
The peak to peak pressure gradient is lower than 37 mmHg. Right radial arterial line trace has a “whip”, “fling” or “standing wave” (or as Ashish puts it in sophisticated terms…”distal pulse amplication”) that artificially increases the systolic pressure. Left femoral arterial line has a more rounded peak which is characteristic of a more central arterial line trace. Since the fling or standing wave overestimates the systolic pressure in radial arterial line, gradient of overestimated. Real systolic pressure in right radial arterial line is unfortunately not possible due to technical limitations.

Ashish’s answer: Right radial artery will be higher when compared to the femoral artery BP due to distal pulse amplification. Therefore, the peak to peak pressure gradient across the coarctation site is probably less than 37 mmHg.

Systolic and diastolic arterial blood pressures are higher and lower, respectively, in radial arteries than in the aorta. This phenomenon is known as distal pulse amplification and is due to the characteristics of the vascular tree. Briefly, a pulse waveform entering the aorta is exposed to a sudden impedance change at the capillary level, resulting in a large increment in resistance and producing reflected pulse waveforms. Those waves are added to the following ones, producing higher peaks than the original aortic systolic peak at different distances from the aortic origin. This distal pulse amplification is always present when peripheral vascular resistance is high.

Reference: Peripheral arterial blood pressure monitoring adequately tracks central arterial blood pressure in critically ill patients: an observational study. Mariano Alejandro Mignini, Enrique Piacentini and Arnaldo Dubin.  Critical Care 2006;10:R43.

Sunday, July 20, 2014

Quiz #31: Answer

This RA trace was recorded in cath lab under endotracheal general anesthesia.
Question: Which wave is the taller one, a wave or v wave?

Answer: a wave (See labelled images below).

RA pressure trace consists of a, c, v waves and x, y descents.
a – atrial systole (occurs immediately after P wave. Note: electrical activity precedes mechanical activity). Dotted line helps to compare the P wave to the RA waveform.
c – bulging of tricuspid valve “cusps” during onset of ventricular systole. This will appear just after LV pressure trace crosses the atrial wave.
v – venous filling (occurs during atrial diastole which is ventricular systole). Therefore, v wave should coincide with ejection phase of ventricle as shown in LV trace or PA line trace.

(Click on the image to enlarge)
Additional images from the same patient - recorded with LPA pressure in one panel and with LV pressure in the other panel. Label indicates where c wave will be expected.


Tuesday, July 15, 2014

Quiz #30: EKG and Doppler Trace - Answer

13 yr old girl was transferred to ICU for atrial flutter. Patient is muscle tremors and is neurologically obtunded, thought to be secondary to severe, systemic vasculitis. Figure 1 is an EKG strip from bedside monitor on the floor. Pulse oximeter trace is present in the strip as well.
In order to clarify the diagnosis, Doppler was performed with the cursor placed between mitral valve and aortic valve.
1)      What is the diagnosis?
Sinus rhythm. Muscle tremors causing fib-flutter pattern. In EKG: Hallmark of atrial fibrillation is irregularly-irregular ventricular rate (which is absent here). Also, pulse ox trace is regular and is normal, beat-to-beat. In Doppler trace: There is 1:1 relationship between mitral inflow and aortic outflow.
2)      How would you manage this?
Just get out of the way and let them manage the obtunded state and muscle tremors.
(Click on the image to enlarge)

Saturday, July 5, 2014

Quiz #29: CT scan, Vacular anomaly

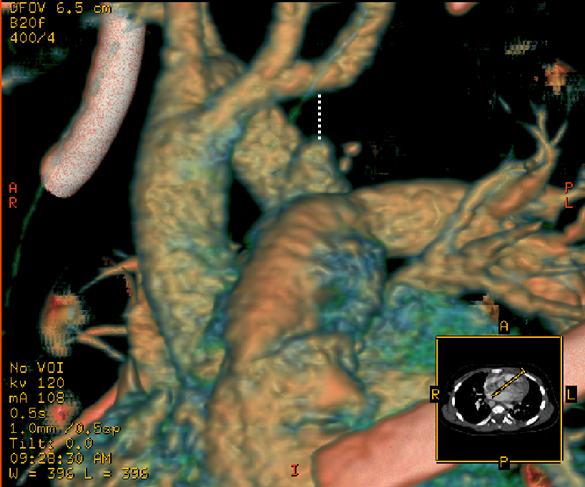
CT scan images from a 8-mo old boy with stridor, vomiting and weighs 5.6 kg. Figure 1 shows anterior and Left lateral views. Figure 2 shows 3D reconstruction of trachea-bronchial tree (Barium swallow was not performed in this patient).

Questions:
1) What is the arch sidedness?
2) What is the diagnosis?
3) Does the patient need intervention and why?

Answers:
1) Right aortic arch (Arrow in the last image shows indentation in trachea).
2) Double arch with ligamentous (atretic), left arch - creating a vascular ring.
3) Patient needs intervention because the patient is symptomatic and failing to thrive.

A differential interpretation for the diagnosis - Question 2 - is "Right aortic arch with left ductal ligament". Where the anterior end of the ligament is attached will determine the difference. If the ligament is attached to the ascending aorta or a branch of the aorta, it is "double arch". Alternatively, if the ligament is attached to the MPA, it is "right arch with ductal ligament". Dotted line is drawn in the images below to help to make this determination.
Arrow in the last figure indicates the indentation in trachea from right-sided arch. Similar indentation is expected in barium swallow.

Sunday, June 1, 2014

Quiz #28: EKG - Answer


1)      Ventricular rate ~181/min (Measure R-R Cycle length is 660 ms. Divide this by 2, because the paper speed is 50 mm/sec, i.e. 340 ms. 60/0.34 = 176/min).
2)      Atrial rate ~363/min (Cycle length measured is 320 ms. Correcting for paper speed, i.e 160 ms. 60/0.16 = 363/min).
3)      Diagnosis: Atrial flutter with 2:1 conduction
4)      Treatment: Because the patient is somewhat unstable, synchronized DC cardioversion. May follow with a medication (probably Amiodarone) to prevent recurrence at least until patient improves hemodynamics and out of ICU.
Arrows indicate the waves recognizable as P wave. I have put arrows close together in the middle only. The presumption is one P wave hiding inside each QRS; thus preventing us from recognizing the rhythm.
When it is a 2:1 conduction, recognition alternate P waves may be difficult. A spontaneous break in the QRSs will helpful in recognizing the rhythm. 2:1 conduction with HR in 170s need not always cause hemodynamic instability because there is 2:1 conduction with apparent A-V synchrony  though only in every 2nd P wave. But, this patient is slowly deteriorating. Therefore, treating this will be necessary – esp. in postoperative period.

Monday, May 26, 2014

Quiz #27 Answer: EKG with ST segment elevation

6 yr old boy, s/p Repair of subaortic membrane. Two EKGs with time are given – both recorded on the day of surgery. One is immediately after coming from OR and the other ~10 hrs later. Second EKG was performed due to EKG change in monitor. Hemodynamically stable. Patient is sleeping without any complaints.
1)      Describe the most significant change.
2)      What is the possible reason for the change?


Answers:
1)      St elevation in every lead except aVL and V1.
2)      Possible pericarditis – post-op.
Other possibilities:
1) Acute Myocardial Infarction
2) Hyperkalemia
3) Hypothermia
(All are discussed below in detail).

Patient Follow-up: No further investigations were done. Discharged home in 48 hrs. without any problems. Treated with Ibuprofen just like many other postop. cardiac patients. Followed by outside cardiologist.
Pericarditis: Characteristics of changes in Pericarditis: ST segment with concavity upwards and presence of this change in multiple leads favors diagnosis of pericarditis.
Ischemia or infarction changes will occur in specific areas that are affected (i.e. inferior leads, anterior leads, lateral leads, etc.) with reciprocal changes in “opposite” leads. Pericarditis typically involves ST elevation “all” leads and may not follow specific lead groups.
(Principles of Clinical Electrocardiography (11th ed) by Mervin J. Goldman. Lange Medical Publications 1982, page 285).

AMI: Figure below shows acute EKG changes in inferior wall infarction in column B (Column A is normal EKG for comparison. Note the shape of ST segment (covexity upwards in II, III & aVF) and reciprocal changes in I, aVL, V1-V6).
(From Principles of Clinical Electrocardiography (11th ed) by Mervin J. Goldman. Lange Medical Publications 1982, page 170)

Hyperkalemia: Hyperkalemia can present this way, but usually is associated with Tall peak T waves as well. Patient’s K in ABGs were normal. Below is an EKG strip from a newborn with Sr. K 9.1. The ST elevation and Tall T waves in hyperkalemia resemble AMI changes. But, these changes (at this Sr. K levels) will be interspersed with other EKG changes of QRS complex and arrhythmias as in this patient. (This baby was diagnosed with congenital adrenal hyperplasia later. Cardiology was consulted for bradycardia!)

Hypothermia: Occurs with characteristic appearance of Osborne waves (arrows). And, also occur with prolongation of QRS duration and QTc. Therefore, it is reasonable to do a 12-l2-lead EKG before instituting hypothermia protocol as an elective procedure (not possible when initiated during CPR).
(Image from internet)

Saturday, May 17, 2014

Quiz 26: Clinical Sign

Questions:
1) Sulcus indicated by the dashed line in the chest of this infant is named after a physician. What name is it.
2)      Provide differential diagnoses for this clinical sign (including at least one relevant to cardiology).


Answers:
1) Harrison sulcus

2)      Diffierential diagnosis: (i) Rickets, (ii) Asthma and (iii) Congenital heart disease with significant L-R shunt. 

Discussion:
The line of indrawing approximately corresponds to insertion of diaphragm and is thought to be caused by repeated, forceful diaphragmatic pull during infancy when the bony cage is relatively soft. This occurs with any condition associated with chest retractions (Asthma & L-R shunt lesions in the heart). In rickets, normal pull of the diaphragm on the softer the bony cage (softer, due to rickets) is considered the reason.

Unnati sent this article on Harrison’s groove: Naish J & Wallis HRE. The significance of Harrison’s grooves. Br Med J 1948;1:541-44. This article has a discussion on mechanism of causation of this groove (or sulcus). It questions the theory of diaphragmatic pull in the early part. But, later part of the discussion provides evidence from work of Herlitz (1945) that supports this theory.